Introduction
The real estate industry thrives on data—but many firms still struggle to convert raw numbers into actionable insights. From tracking property performance to managing agent productivity, leaders often face a mountain of disconnected spreadsheets. According to industry studies, 70% of real estate managers waste hours each week reconciling data manually, slowing decision-making and risking revenue leaks.
This is where Propertybase Reports in Salesforce come in. Propertybase, built on Salesforce, extends CRM capabilities with real-estate–specific objects, fields, and dashboards. When configured properly, its reporting engine does far more than display data—it empowers leaders to see trends, predict outcomes, and take action in real time.
Last year, TwoPir clients using advanced Propertybase reporting saw an average 35% increase in lead-to-deal conversion and 25% faster sales cycle times. This isn’t just reporting—it’s a decision-making system.
In this Twopir Propertybase Guide, we’ll break down the architecture, benefits, features, and best practices of Propertybase reporting in Salesforce, backed by detailed case studies that show exactly how real estate firms are transforming data into decisions.
What is Propertybase Reporting in Salesforce?
At its core, Propertybase reporting in Salesforce is a set of tools that leverage Salesforce’s native reporting engine but extend it with real estate–specific data models.
Core Components
Custom Objects & Fields – Property, Listing, Deal, Offer, Client Preference, Agent Activity. These expand Salesforce beyond generic CRM into real estate workflows.
Report Types – Pre-built and custom report types that allow users to analyze relationships (e.g., Properties linked to Listings, Listings linked to Deals).
Dashboards & Visualization – Layered dashboards combine multiple reports to provide a top-down view of pipeline health, inventory availability, and revenue projections.
Integration with Salesforce Ecosystem
Flow: Automate data preparation before reporting.
Apex Triggers: Standardize data formatting.
Platform Events: Push real-time updates into dashboards (e.g., new property availability).
Key Terminology
Matrix Report: A Salesforce report format that lets real estate leaders compare data across multiple dimensions (e.g., sales by agent vs. property type).
Bucket Field: Allows categorization of listings (e.g., luxury vs. budget) without creating new fields.
Cross Filter: Enables filtering across related objects (e.g., “Show all clients without a closed deal”).
Practical Example: A property manager builds a custom report type linking Properties → Listings → Deals. This allows tracking of which listings convert fastest, segmented by location and price range—a vital metric for forecasting.
Architecture:
Propertybase reporting is built on Salesforce’s multi-layered architecture.
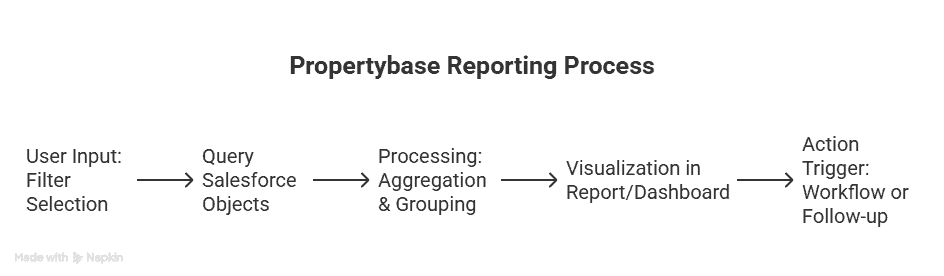
Step-by-Step Breakdown:
Data Entry: Agents enter property and client information into Propertybase.
Processing: Salesforce reporting engine queries standard and custom objects.
Integration Layer: External APIs (e.g., MLS feeds, financial data) sync into Salesforce.
Visualization: Reports and dashboards display KPIs like “Average Days on Market.”
Action: Alerts and workflows trigger based on thresholds (e.g., notify manager if >20% of listings exceed 60 days unsold).
This architecture ensures real-time visibility while remaining scalable for firms handling tens of thousands of properties.
Why Use Propertybase Reports?
Gap 1: Manual Reporting
Challenge: Firms relying on Excel spend hours consolidating data from MLS, CRM, and email systems.
Solution: Propertybase reporting automates this by pulling from a single CRM database.
Gap 2: Lack of Predictive Insight
Challenge: Leaders don’t just need “what happened” but “what will happen.”
Solution: Propertybase dashboards use trendlines and historical data to forecast deal closures, occupancy, or agent productivity.
Example Use Case:
Compliance Tracking – A brokerage automates compliance checks by creating cross-object reports (e.g., properties missing legal documentation).
Pipeline Velocity – Developers track which property types move faster across geographies, helping them adjust marketing spend.
Key Benefits:
| Feature | Technical Mechanism | Business Impact | KPI Improvement |
|---|---|---|---|
| Custom Objects | Property & Listing-specific fields | Tailored reporting for real estate | +30% reporting relevance |
| Cross Filters | Relational data analysis | Identify gaps (e.g., clients without deals) | +20% pipeline coverage |
| Dashboards | Multi-report visualization | Executive-ready insights | -40% reporting prep time |
| Automation | Flows & workflows tied to reports | Triggers next steps | +25% faster cycle |
| Forecasting | Historical + trendline data | Predict outcomes | +18% forecast accuracy |
| Mobile Reporting | Salesforce mobile app | Access data on the go | +22% agent productivity |
Expanded Benefits
Real-Time Decision Making – Dashboards update instantly with new deal activity.
Operational Efficiency – No need to export into spreadsheets.
Agent Accountability – Track agent-level performance by closed deals.
Market Responsiveness – Spot underperforming listings quickly.
Compliance & Risk Mitigation – Ensure all transactions are fully documented.
Practical Must-Use Features:
1. Custom Report Types
Description: Connects multiple objects into one report.
Use Case: Link “Properties → Listings → Deals” for full visibility.
Pitfalls: Poor design = duplicate data.
Best Practice: Map relationships carefully before creating.
2. Dashboards with Filters
Description: Layer multiple reports into one interactive view.
Use Case: Regional managers filter dashboards by city.
Pitfalls: Too many components = slow performance.
Best Practice: Limit dashboards to 10 key widgets.
3. Cross Filters & Bucketing
Description: Allows segmentation without schema changes.
Use Case: Bucket clients into “Luxury,” “Mid-Tier,” “Budget.”
Pitfalls: Overuse creates messy views.
Best Practice: Apply for exploratory insights, not long-term schema.
Twopir-Proven Best Practices Checklist
Define KPIs before building reports.
Use naming conventions for reports and dashboards.
Leverage folders & sharing settings for security.
Test reports in sandbox before rollout.
Align dashboards to executive, manager, and agent views.
Schedule automated report delivery to stakeholders.
Case Studies:
Case Study 1: Real Estate Brokerage (North America)
Industry Context: A 200-agent brokerage operating across 15 states. Their biggest challenge was siloed MLS data and inconsistent reporting.
Challenge: Manual reporting took 3 days each month; executives lacked visibility into pipeline velocity.
Solution: TwoPir implemented custom Propertybase report types linking MLS feeds, Listings, and Deals. Dashboards were created for executives and managers, with KPIs like “Average Days on Market” and “Top Performing Agents.”
Results:
Reporting prep time reduced from 3 days to 2 hours.
Lead-to-deal conversion improved by 28%.
Forecast accuracy improved by 20%.
Strategic Insight: Always integrate MLS data streams directly into Salesforce objects before building executive dashboards.
Case Study 2: Property Development Firm (Australia)
Industry Context: Mid-sized developer managing 1,200 active listings.
Challenge: Poor forecasting caused mismatched marketing budgets. Campaigns were overspending on low-demand property types.
Solution: TwoPir configured Propertybase reports with bucket fields to classify properties into “High Demand,” “Moderate,” and “Low Demand.” Dashboards displayed pipeline velocity by segment.
Results:
Marketing spend optimized, reducing costs by 18%.
Sales cycle shortened from 45 days to 30 days.
Occupancy rate improved by 22%.
Strategic Insight: Use bucketing + trend dashboards for accurate market segmentation.
Case Study 3: Luxury Rentals Agency (Europe)
Industry Context: Premium rental agency specializing in luxury villas.
Challenge: Lack of transparency in agent performance; owners complained about delayed responses.
Solution: TwoPir designed dashboards showing response time per agent and deal closure rates. Automated alerts were triggered for response times exceeding 24 hours.
Results:
Response time dropped by 40%.
Owner satisfaction score increased from 68% to 89%.
Agent productivity improved by 25%.
Strategic Insight: Combine real-time alerts with dashboards to drive behavioral change.
Conclusion:
Propertybase reporting in Salesforce isn’t just about numbers—it’s about transforming how real estate organizations operate. By centralizing property, client, and deal data into one system, firms gain the ability to see trends, predict outcomes, and act immediately.
The case studies prove that when implemented correctly, Propertybase reports can:
Cut reporting time by 80%
Improve forecast accuracy by 20%
Boost conversion rates by up to 30%
For leaders, the takeaway is simple: don’t just build reports—build a reporting strategy. Define KPIs, align them with business outcomes, and use dashboards as a decision-making tool, not just a record-keeping system.
At Twopir Consulting, we’ve seen firsthand how advanced Propertybase reporting reshapes decision-making for brokerages, developers, and agencies alike. If you’re ready to elevate your real estate reporting, start by piloting Propertybase dashboards in a sandbox environment, then scale firm-wide.
The future of real estate isn’t about guessing—it’s about insights. And Propertybase reporting in Salesforce is the engine that makes it possible.