Salesforce Wave Analytics: Unleashing Insights
Introduction:
Salesforce Wave Analytics simplifies data analysis and visualization, offering a cloud-based solution for deriving actionable insights from diverse data sources.
Salesforce Wave Analytics:
In our day-to-day work life, we deal with lots and lots of data. This data can be in any format structured, unstructured, reports, tables, excels, PDFs, text files, external system, API etc.
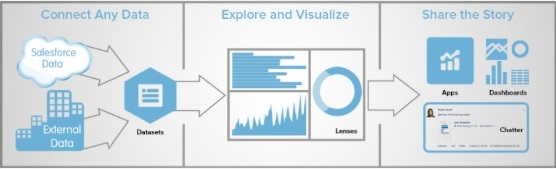
It is very important to have an avenue using which data scientists can retrieve useful information and present it in an understandable format. Salesforce Wave Analytics, also called Analytics Cloud is a Business Intelligence (BI) platform optimized for mobile access and data visualization. It is a cloud-based platform for connecting data from multiple sources, creating interactive views of that data and sharing those views in dashboards. It’s a better way to distribute insights to business users so they can understand and take business action on changing information.
How Does it work?
Create aggregated views of disparate data – Salesforce or external data by loading it into datasets, and then slice and dice the data to get the answers you need to run your business. All inside of salesforce. Save your insights, share them with others and start the discussion on the same.
Wave Platform Setup Process:-
Enable Wave and assign permission to set licenses to users. The first step is simply to enable it. Each permission-set license can be assigned to only one user. Also, the user license that’s associated with the user profile must support the Analytics Cloud-Wave Analytics Platform permission set license. Not all user licenses support the Wave platform permission set license.
- Each Wave platform user needs an Analytics Cloud – Wave Analytics Platform permission set license to use the Wave platform.
- Community users need an Analytics Cloud – Wave Community Users permission set license to view Wave apps shared via dashboards embedded in Visualforce pages.
The Analytics Cloud – Wave Analytics Platform permission set license enables the following permissions.
- Use Wave Analytics
- Create and Edit Wave Analytics Dashboards
- Create Wave Analytics Apps
- Upload External Data to Wave Analytics
- Edit Wave Analytics Dataflows
- Manage Wave Analytics
- Download Wave Analytics Data
Following salesforce licenses support Wave permission set license:
- Force.com(app subscription)
- Force.com(one app)
- Full CRM
- Salesforce Platform
- Salesforce Platform One
Wave Analytics–Lenses and Dashboards :
Sometimes the Standard Dashboards provided by Salesforce do not capture all of the data you need to see, or there are some Objects that you have added as Datasets and now, you need to create some Dashboards to show that data.
Dashboards:-
Before you start creating Lenses, you will need a Dashboard to clip them to.
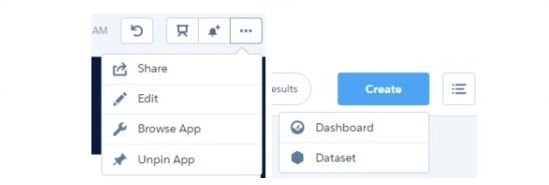
Each template can help serve a purpose, either it being comparing Sales from the prior year to the current year with the Comparison Dashboard, diving deeper into a chart, and seeing details around it with the Details Dashboard, or starting from scratch and using the Blank Dashboard.
Lenses :
In the Dashboard, you can easily create steps to attribute to Dashboard components by clicking Create Step and selecting the Dataset that you wish to build off.

For example, you can create a Step for all Opportunities grouped by Close Date (Year) and sub-grouped by Close Date (Quarter). Also, if you want to measure against something other than Record Count, you will need to change that. By default, all Lenses are initially set to Record Count for the measure and a horizontal bar chart.
If you wish to change the chart type, click the button with the horizontal bars (seen to the right), if you wish to change an existing Measure or Grouping, you can simply click the specific one you wish to change, and set it to the new format. Once you have your step completed, click Done and you will see it in the Step List.
Use Case:-
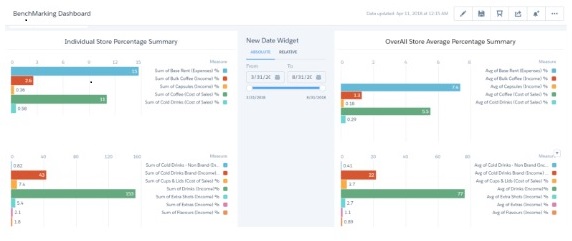
Benchmarking chart Dashboard: –
- Partners wave dashboards give them a summary of their performance vs the overall performance of other partners. This is to give partners a sense of competition wherein they can compare their figures with the average of how other stores are performing.
- Client Management at any given point in time can view the performance of each partner, and compare quarterwise figures to make crucial business decisions using wave analytics.
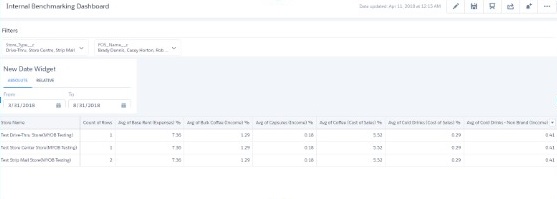
Dashboard for Internal users to view the performance of partners’ store
Conclusion:
Salesforce Wave Analytics emerges as a game-changer in the realm of data analytics and business intelligence. By providing a user-friendly interface for data visualization and analysis, it empowers organizations to unlock the full potential of their data assets. Whether it’s monitoring performance metrics, tracking sales trends, or making strategic decisions, Wave Analytics equips users with the tools they need to thrive in today’s data-driven landscape. With its seamless integration with Salesforce and robust features, Wave Analytics is poised to revolutionize how businesses leverage data to drive success.