SALESFORCE MARKETING CLOUD INTELLIGENCE REPORT
What is Intelligence Report in Salesforce Marketing Cloud?
Intelligence Reports (formerly Datorama) in Marketing Cloud allows users to view, share, and generate, detailed analysis of Email data you’ve integrated into Marketing Cloud.
You can save these reports locally or share them via email or the cloud. The data uploaded into Intelligence is displayed as a flat file and includes selected dimensions and measurements within a defined time range.
You can run reports as part of a workflow in real-time, or according to a defined schedule. You can create data reports and visual reports. Data reports display data in an Excel, CSV, TSV, or TXT file. Visual reports create a screenshot of a dashboard page that you can export as a PNG, PDF, or PPT file.
The Essential Points You Should Know about Data:-
- Marketing Cloud has a feature that helps to make historical data easily available for up to 90 days.
- Daily basis data refreshment feature, once per account every 24 hours at a variable time.
- Users can continue to access reports using the data they already have while the procedure automatically retries every few hours in the case that there is a problem with the data retrieval from Marketing Cloud to Intelligence.
- Information is destroyed from the Intelligence Report within 90 days of the deletion of a contact record for one or more subscribers inside the Marketing Cloud. When an Intelligence membership is canceled, all client data is erased in compliance with the Marketing Trust and Compliance Documentation.
- Marketing Clouds offers some Data elements,
Dimensions: Descriptive non-numerical data, such as Audience Name and Email Sender IP.
Measurements: Quantitative numerical data, such as Email Bounces and Email Deliveries.
How to Use Intelligence Reports :-
Navigate to Analytics Builder -> Intelligence Reports:
Dashboard:
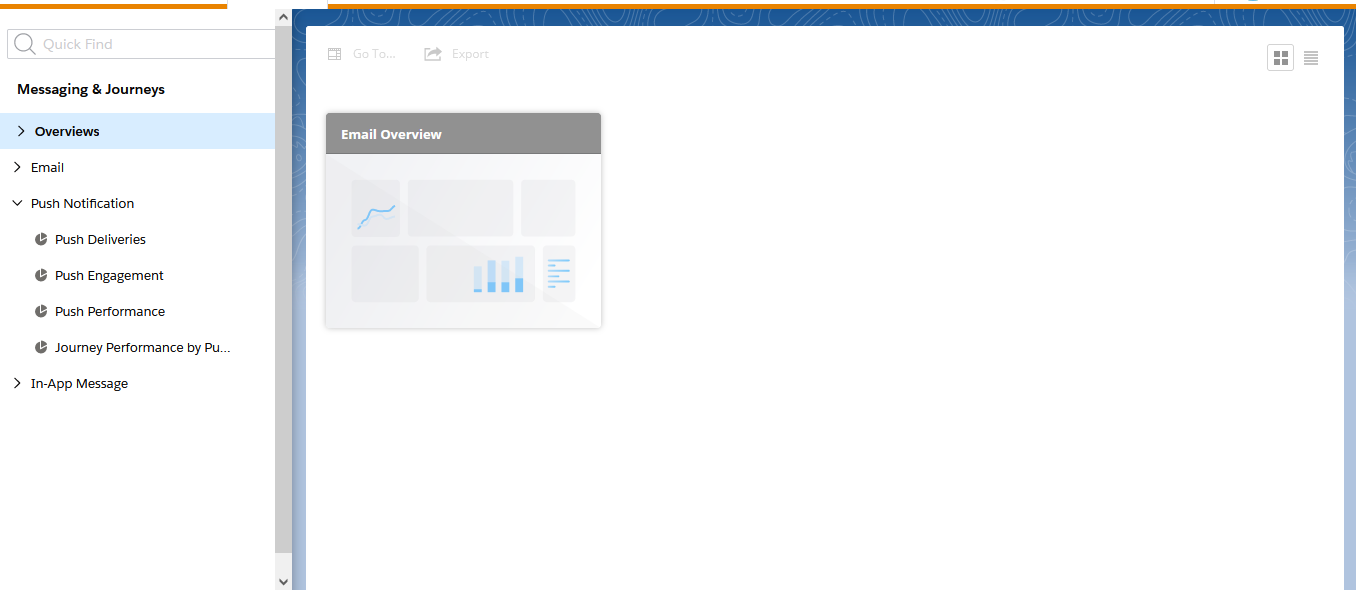
- Preconfigured Dashboards include Email insights such as Overview, Deliveries, Engagement, Performance, and Journey Performance and push insights such as Deliveries, Engagement, and Performance and Journey Performance.
- Collections organize related dashboards together; linked components refer to the end date.